


Quartix introduces new Dashboards feature
Quartix has enhanced the customisation abilities of its reporting tools with the addition of new Dashboards, providing businesses with increased control over how they view their fleet’s activities in real-time.
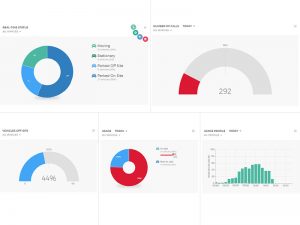
The new Quartix Dashboards provide customisable reporting on real-time status, overall vehicle usage, individual call-outs for each vehicle and vehicles offsite
Available to new and existing customers, the Quartix Dashboards are made up of a number of components, providing comprehensive details on real-time status, overall vehicle usage, individual call-outs for each vehicle and vehicles offsite. More components will be made available as they are developed
Each component can be viewed on the Live Status Dashboard, which can be rearranged to best suit needs. The components use simple and clear graphs to display a variety of live fleet information and offer a variety of customisation options, including viewing the entire fleet or specific groups of vehicles.
Current components cover:
Usage Profile
This is displayed as a bar chart, this shows the percentage of vehicles in use either for each hour of the current day or for each day of the week. Clicking on any bar in the chart will list the vehicles in use and not in use during that time period, in separate, scrollable lists. Users can then click on a vehicle to view its daily log (for vehicles in use) or last location (for unused vehicles).
Usage
This doughnut chart shows the vehicles that are used and unused for either the day or the week as whole, rather than by the hour as in the Usage Profile. As a default, a vehicle will be considered ‘used’ if it has made a trip that exceeds 250 metres, although this is customisable via the admin window and can be defined by an ignition-on event. A utilisation target can be set or users can stipulate the percentage of the fleet that must be in use during the time period. An alert can also be set up to show if this has not been reached.
Individual vehicles can also be viewed to show their daily log (for vehicles in use) or last location (for unused vehicles).
Number of Calls
This component, displayed as a speedometer, shows the number of calls made as compared to a set target number.
Users can determine the calls per day per vehicle, the alert start time, and whether or not to include stops where the ignition is left on.
Vehicles Off-Site
This component, displayed as a speedometer, shows the number of vehicles that are away from their overnight location, to give the measure of fleet activity, with a percentage target point displayed.
Users can see vehicles in use and not in use for a specific time period, in separate, scrollable lists and can click on a vehicle to view its daily log (for vehicles in use) or last location (for unused vehicles).
Real-Time Status
This doughnut chart summarises what all selected fleet vehicles are doing at the current time, with options covering: Moving, Stationary, Parked Off-Site and Parked On-Site.
Targets levels and alerts can be customised.
A Quartix spokesperson added: “These five components offer quick and comprehensive views of the most vital functions of a mobile fleet and make staying on top of operations easier than ever.”

Natalie Middleton
Natalie has worked as a fleet journalist for over 20 years, previously as assistant editor on the former Company Car magazine before joining Fleet World in 2006. Prior to this, she worked on a range of B2B titles, including Insurance Age and Insurance Day.